
22 July 2020 - Obstetrics
Program
1000-1015: Recap
1015-1045: Physiological Changes in pregnancy: Andy
1045- 1115: Emergencies after 20/40 and post partum: Jonathan
Break:
1145-1215: Emergent Delivery: Joel
1215-1230: Gas/ case presentation Mark and Joel
1230-1245: Image/ ECG/ Tox: with Jac and Alex
1300-1400: SAQs: Sarah
Key Learning Points
Thanks Hope for providing a great recap of this week’s teaching.

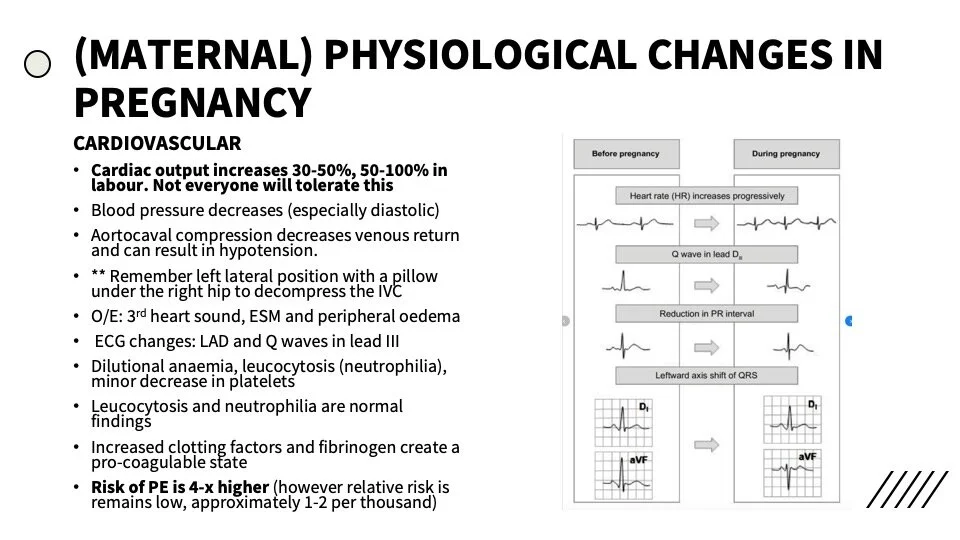
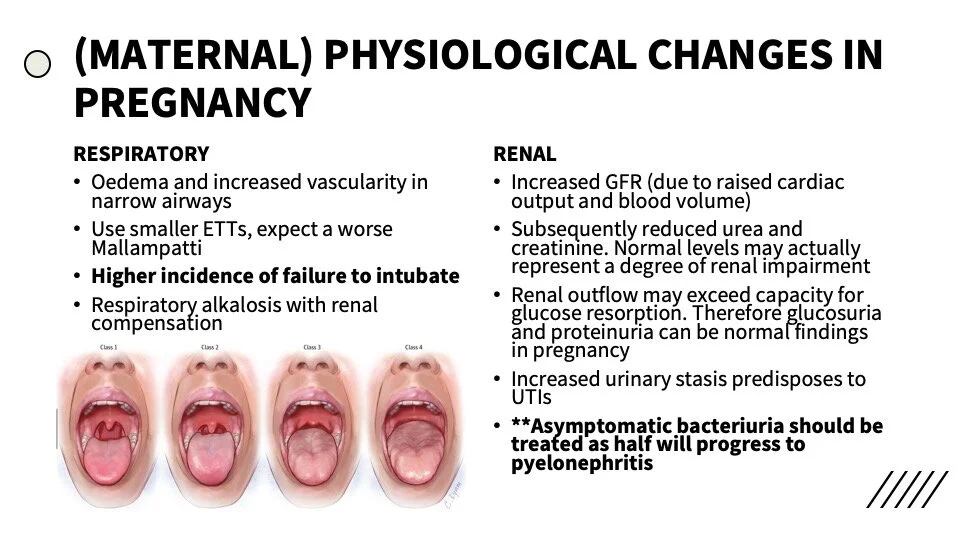
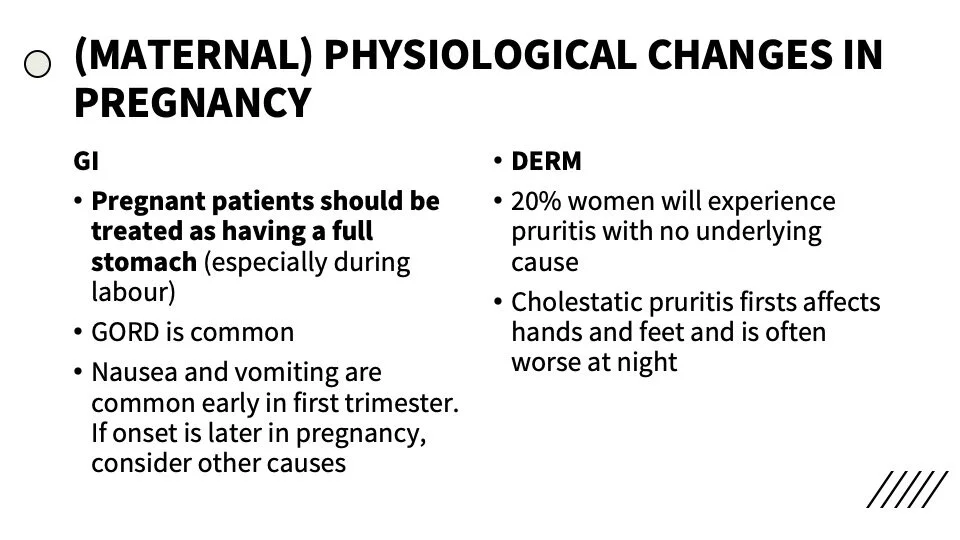
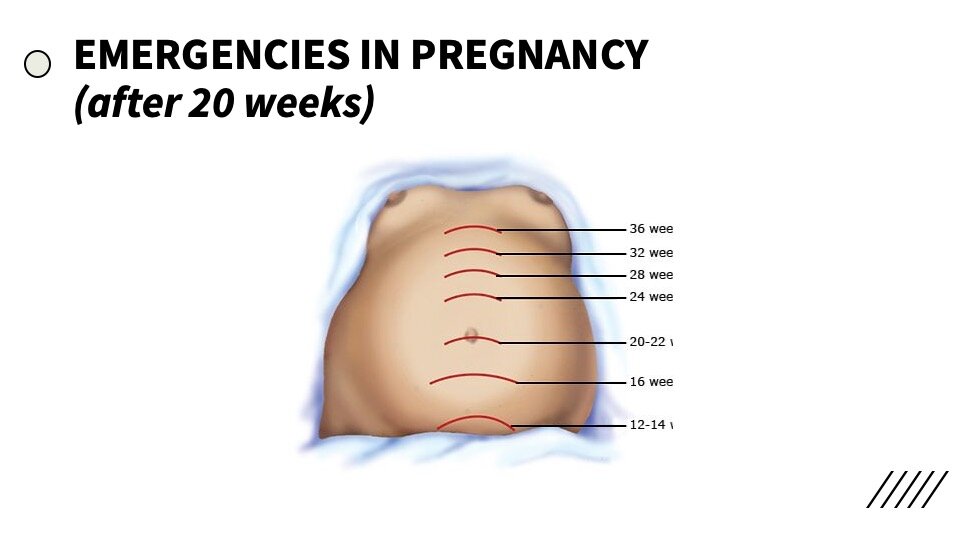
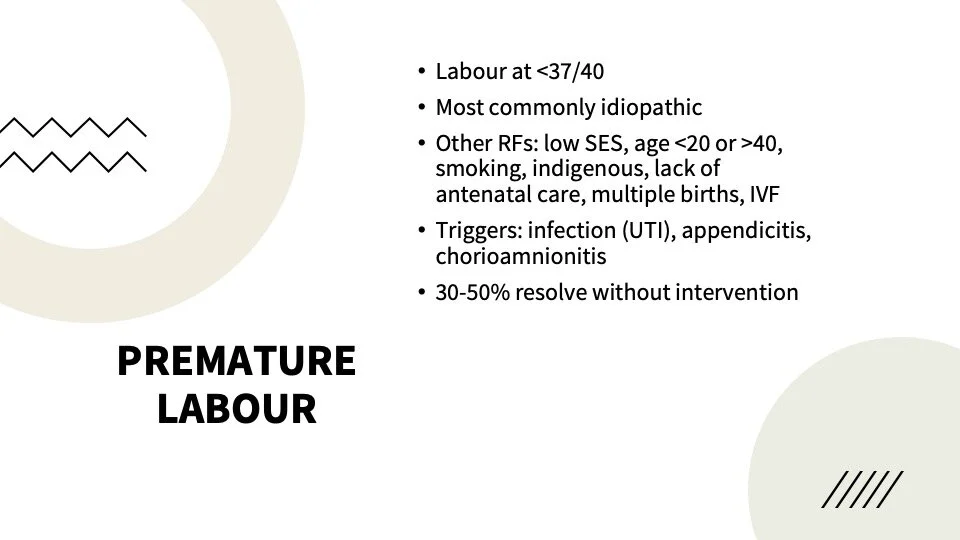
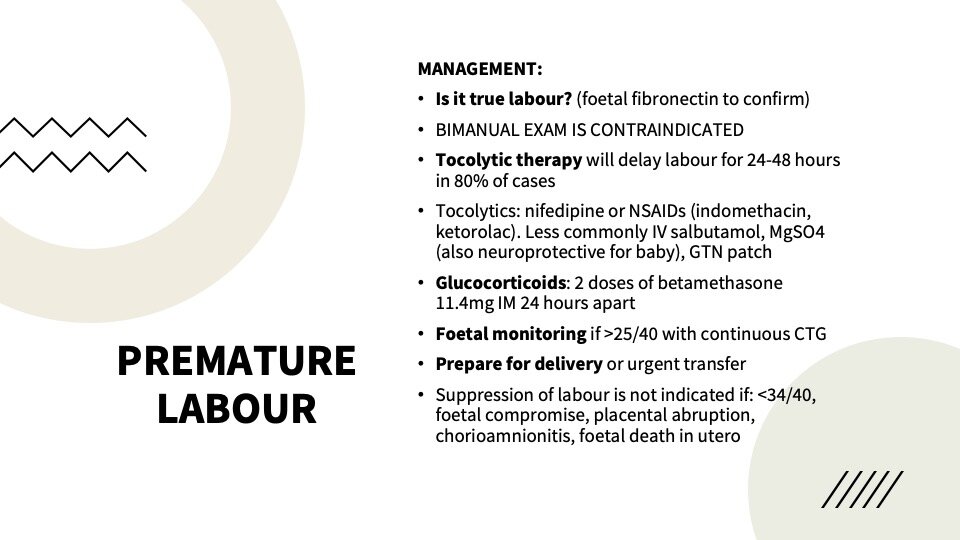
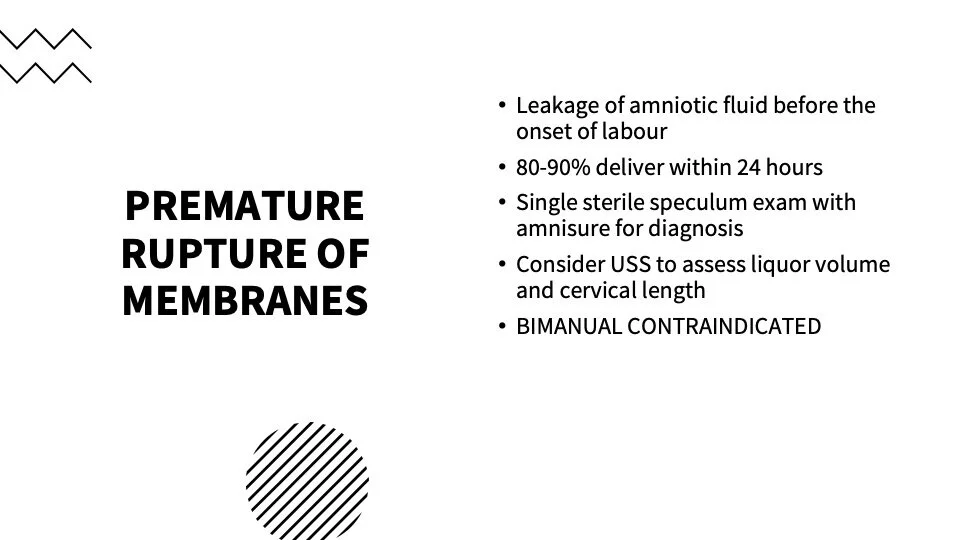
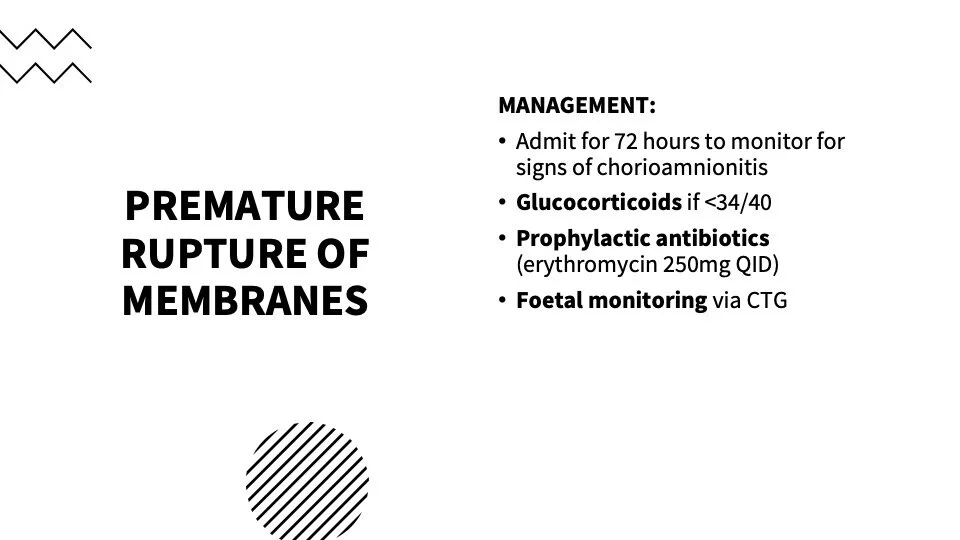
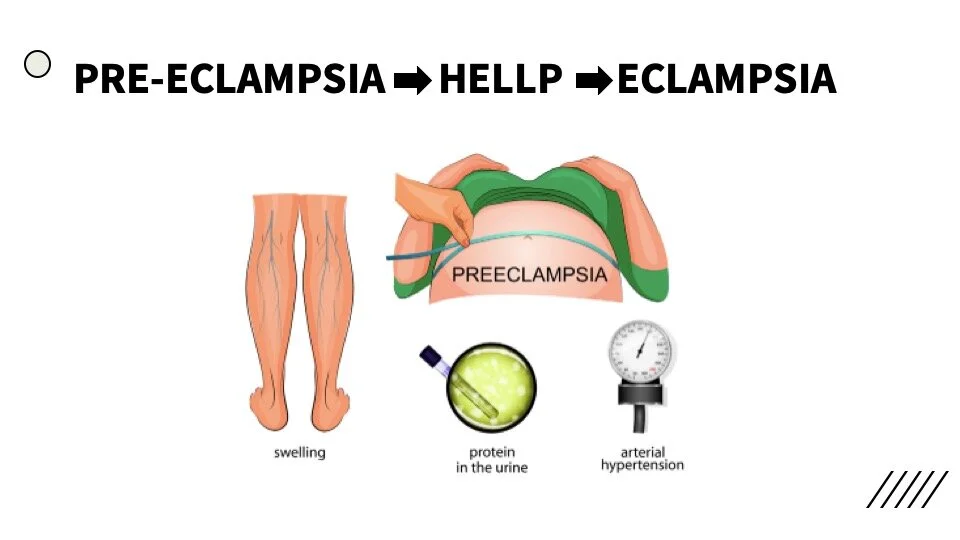
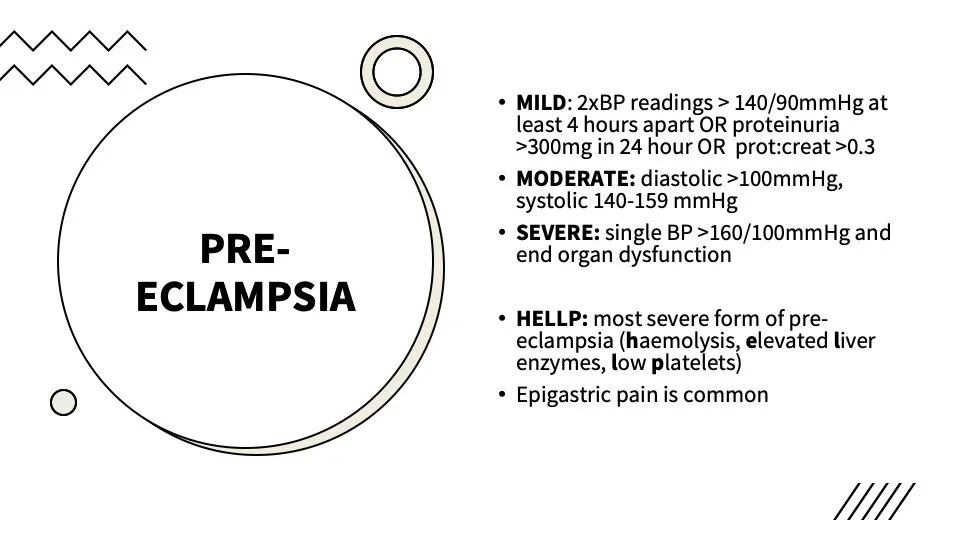
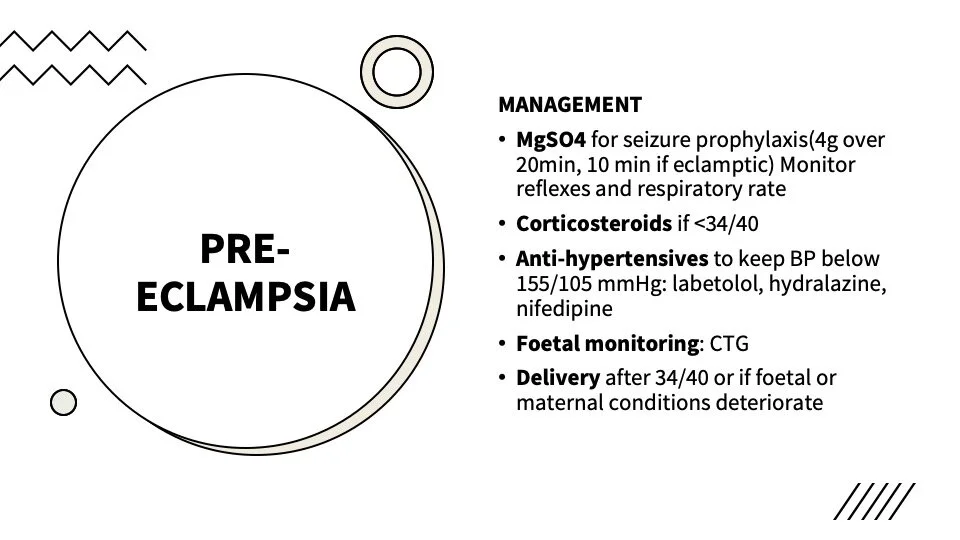
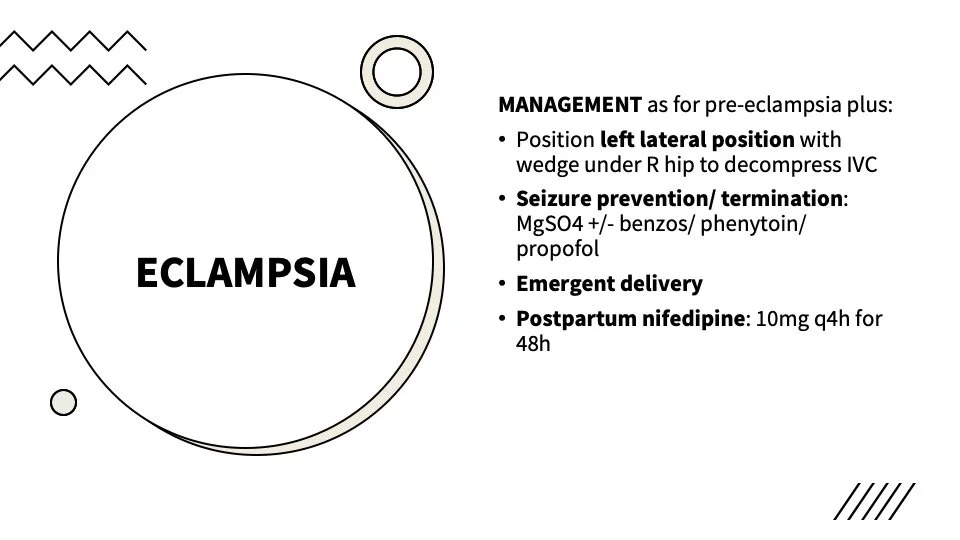
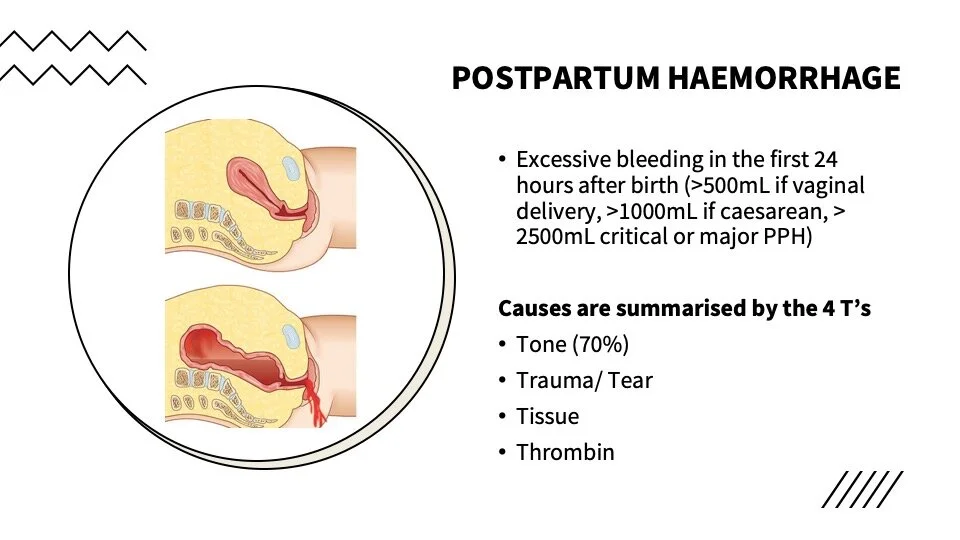
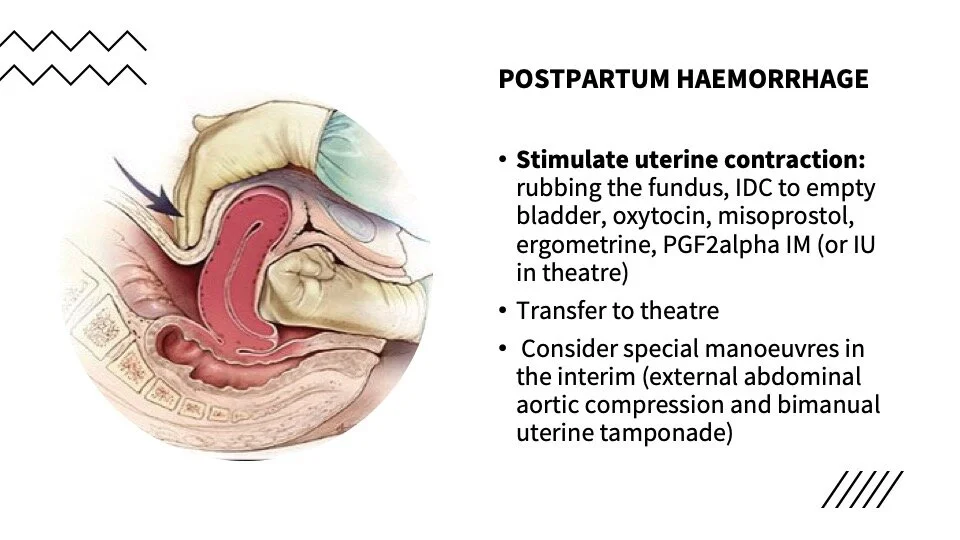

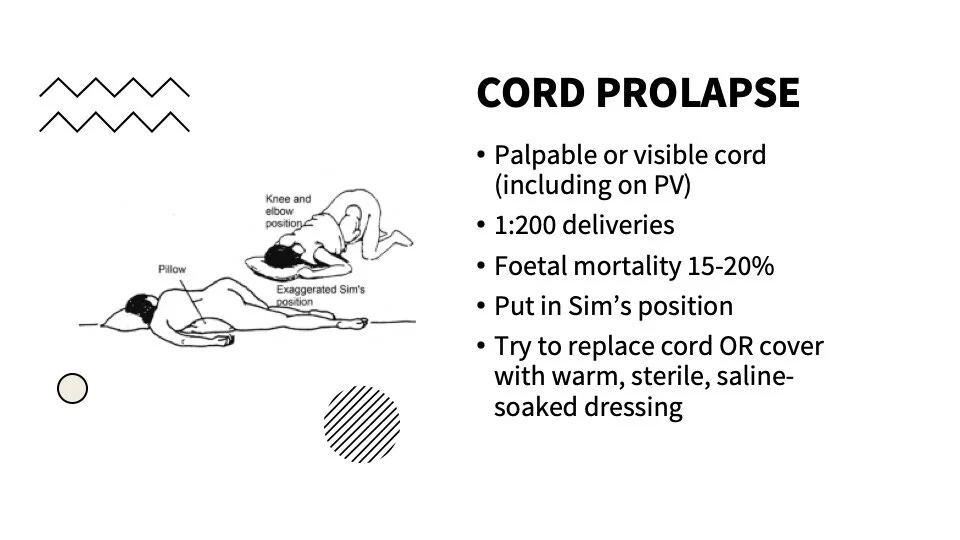
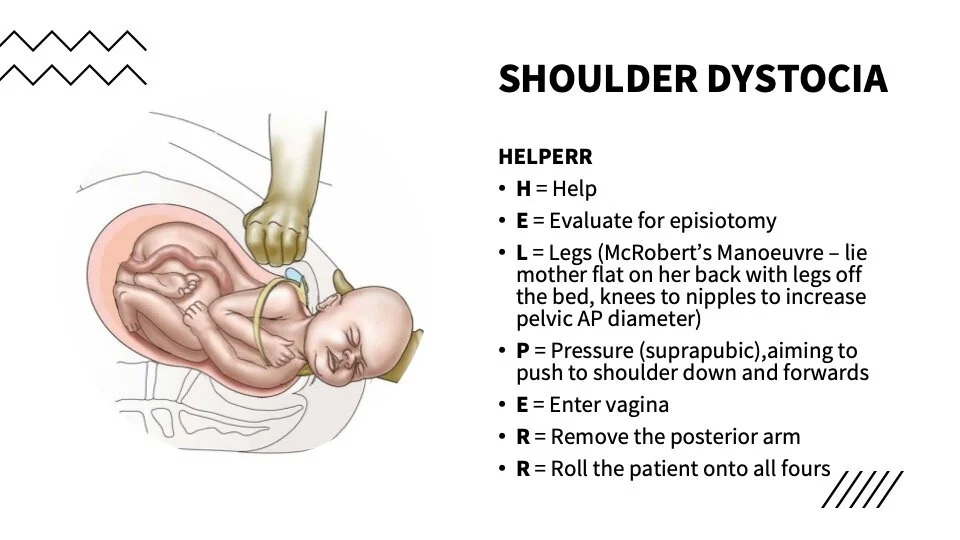
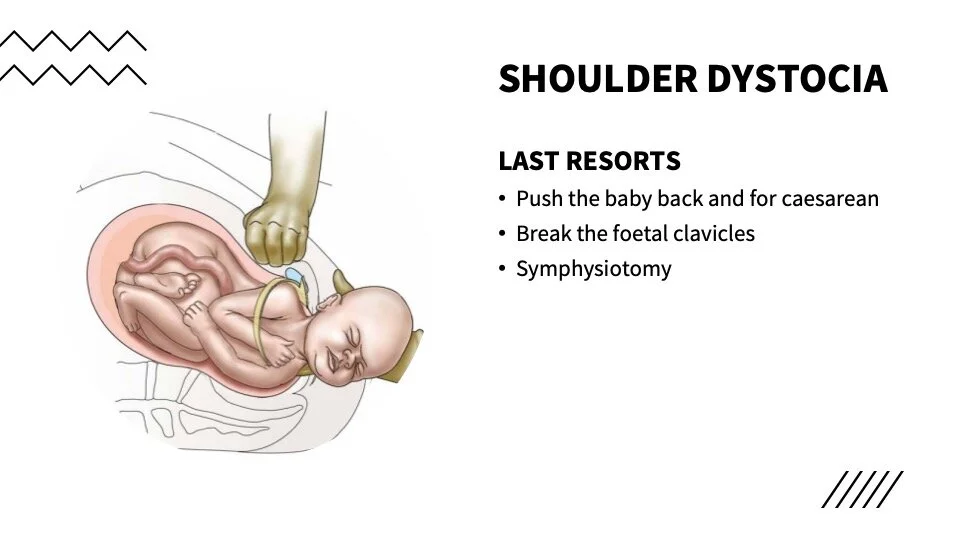
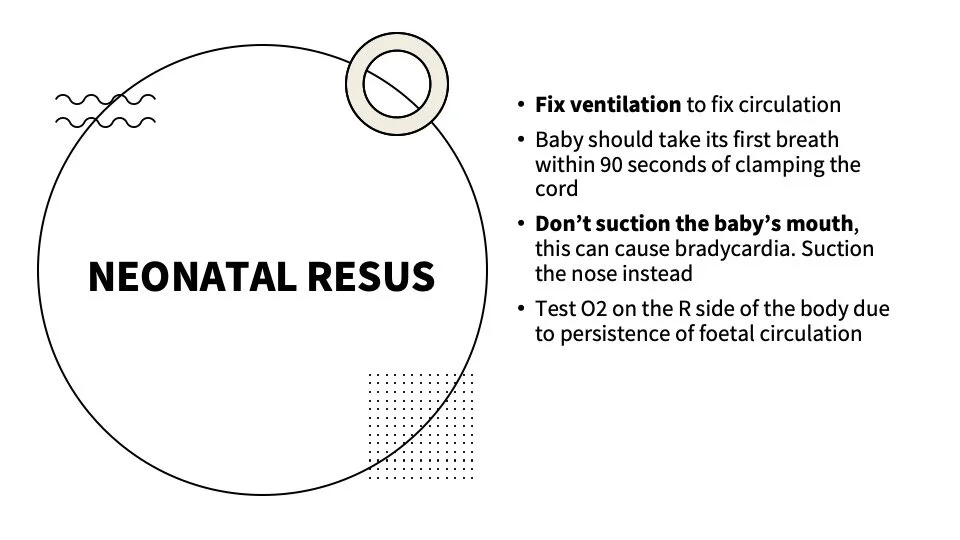
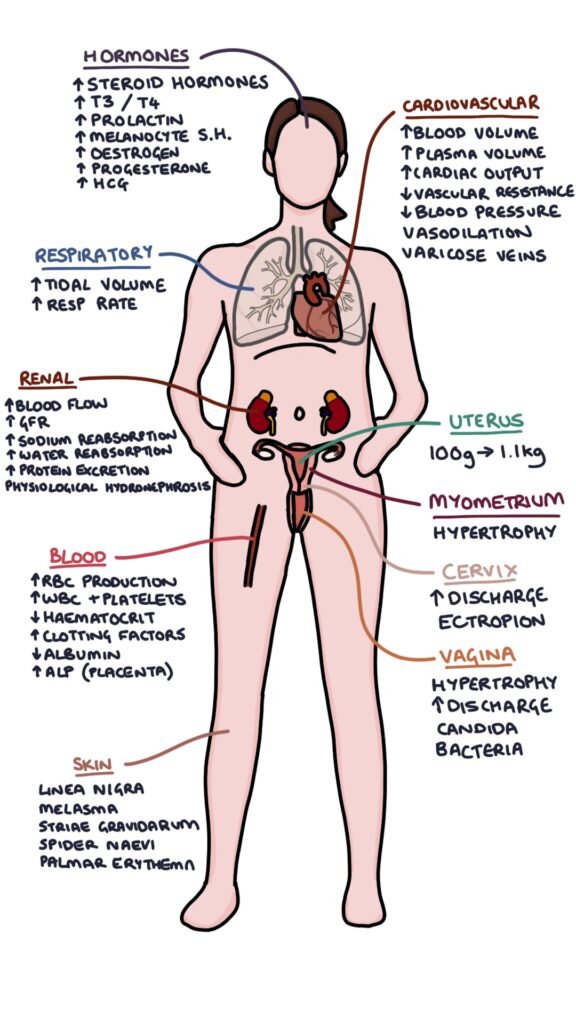
Physiological Changes of Pregnancy
These frequently come up on college examinations. Summarized in the images below
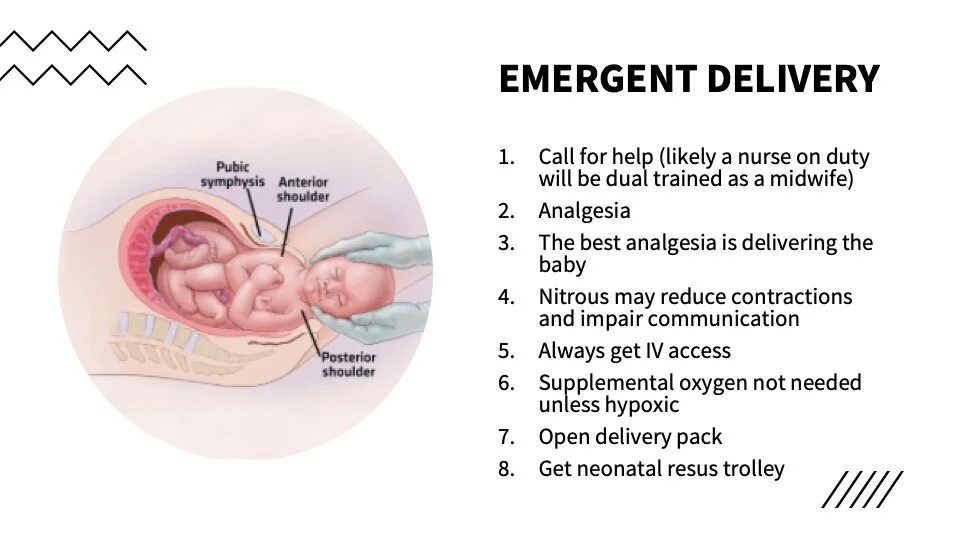
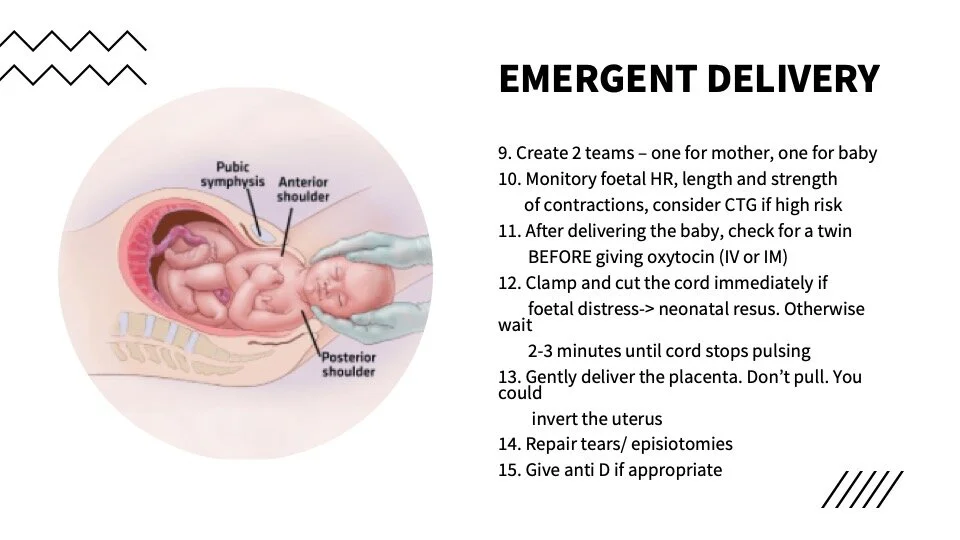
Pregnancy Emergencies and emergent delivery
Check out ObCast. There are a series of approximately 10 minute videos on relevant conditions produced by an Australian emergency physician with an interest in obstetrics. He succinctly covers all relevant obstetric conditions for the emergency doctor.

ECG of the Week
A 34 yo female presents to the ED with acute onset chest pain and breathlessness. She is 26/40 pregnant. Vital signs SpO2 92% RA, RR 24, HR 130, BP 110/90.
This ECG shows a sinus tachycardia, RBBB and inverted T waves in anterior leads and lead III. It would be consistent with PE in the right circumstance.
Additional findings that can sometimes be seen in PE include: right axis deviation, P pulmonary ale, S1Q3T3 pattern, atrial arrhythmias such as AF, and non-specific ST and T wave changes.
It is important to note that ECG findings are not particularly sensitive nor specific for PE. Rather they should be used to add to your pre-test probability when considering a PE. The most likely findings in PE are non-specific ST segment and T wave inversions and sinus tachycardia.
These ECG changes are due to:
dilation fo the right side of the heart with consequent shift in position of the heart
right ventricular ischaemia
increased sympathetic supply due to pain, anxiety and hypoxia
What about the ECG in pregnancy?
Some ECG changes that can be normal in pregnancy include: deviation fo the QRS axis towards the left as pregnancy advances, increasing incidence of Q waves in inferior leads and increased incidence of T-wave abnormalities in lead III and V1-V3
Image of the Week
A 26 yo female presents with pelvic pain. You have a quick look with the ultrasound probe and you freeze the below frame.
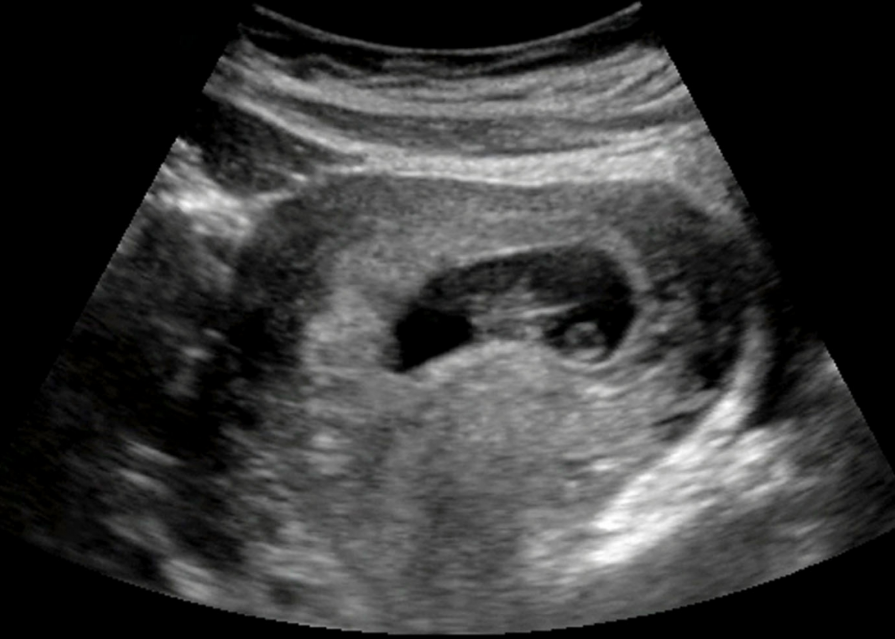
This still of an ultrasound shows a gestational sac with a yolk sac and fetal pole within it.
Gestational sac: this is the first sign of pregnancy on ultrasound. It appears as a anechoic structure within the uterus and is often visible by 3-5 weeks on transvaginal scanning. Care needs to be taken not to mistake a pseudogestational sac, however if the bHCG is positive it likely is a gestational sac.
Yolk sac: This a the first anatomical structure identified within the gestational sac and can often be seen by 5-6 weeks on transvaginal scan and slightly later on transabdominal scan. It is a ring like structure (seen on the right of the image above) and is usually present until about 10 weeks after which it can no longer be seen.
Fetal pole: this the first direct imaging of the foetus and is initially seen as a thickening on the margin of the yolk sac. It can often be seen by about 6 weeks on transvaginal scan. When the crown rump length is >7mm we should begin to be able to see a fetal heart beat.
Remember, these patients require formal ultrasonography as the sensitivity of a trained ultrasonographer with a transvaginal probe is far greater than what we can do.
A word on bHCG and ultrasound
There is a concept of the discriminatory zone, above which a gestational sac should be seen. However the exact number of bHCG is controversial. A rough idea is that a gestational sac should be seen on TV scan when the bHCG is above 1500 or 2000 and should be seen on abdominal scan when above 5000-6000.
Clinically, serial bHCG measurements and repeat imaging is usually more practical when in doubt.
Gas of the Week
A 30 year old female is BIBA following a suicide attempt. She is refusing to talk to the paramedics other than complaining of a headache, nausea and a sore throat. (No, she does not have COVID). Paramedics noted that on the way into hospital she vomited about a cup of bright blue liquid.
See the blood gas and biochemistry below.
How would you manage her?
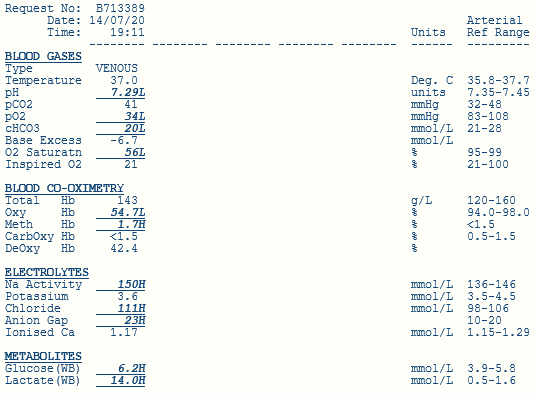
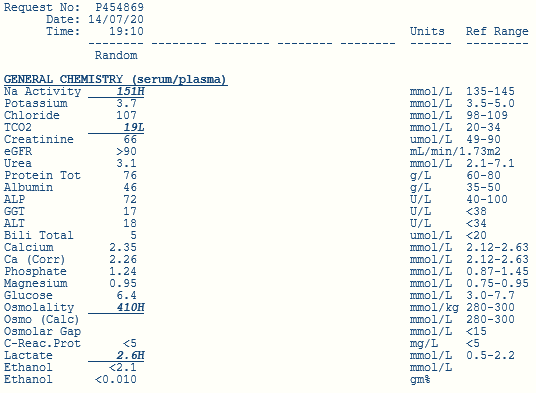
Overall, the primary acid base disturbance is a metabolic acidosis evidenced by a mildly lowered pH, mild decrease in bicarb and mild negative base excess.
Respiratory compensation can not be adequately assessed given the gas is from a venous sample.
Using Fencl-Stewart
SID = 150 + 3.6 - 111 = 42.6, therefore no chloride effect
No albumin effect
Lactate effect -13 on the base excess
With the base excess of -6 is there another unknown metabolic alkalosis?
Using a traditional method
AG = 19 (or 22 if you include the potassium) - either way, there is a RAGMA
Delta ratio
If you use the AG without potassium the ratio is 1.75 indicating a pure RAGMA
If you use the AG with potassium the ratio is 2.5 indicating a pre-exisiting metabolic alkalosis. But why? This doesn’t exactly make sense.
Osmolar Gap = osmolality - osmolarity
Osmolality (measured): = 410
Osmolarity (calculated) = 2 x Na + Urea + Glucose = 310
Therefore there is a large osmolar gap of 100. In this case, this is due to toxic alcohol poisoning.
Lactate
Note the large discrepancy between the lactate on the gas (14.0) and the lactate on formal bloods (2.6)
Well there is often a spuriously elevated lactate in ethylene glycol poisoning as one of its metabolites, glycolic acid has a very similar structure to lactate. This difference is known as the lactate gap. It is seen when two different analysers are used where one can cause artificial elevation and the other cannot. When seen, this is highly suggest of ethylene glycol poisoning. There is a further explanation in this lancet article.
So what does this mean?
If we use the actual lactate in our Fencl-Stewart calculations then the sum base-effect is -2 compared to -6 measured so there is possibly a minor additional unmeasured acidosis such as ketones. Using a traditional method the calculations are unchanged noting that toxic alcohol poisoning is a known cause of a RAGMA.